Save current warn/crit thresholds in the RRD File and show history in graph
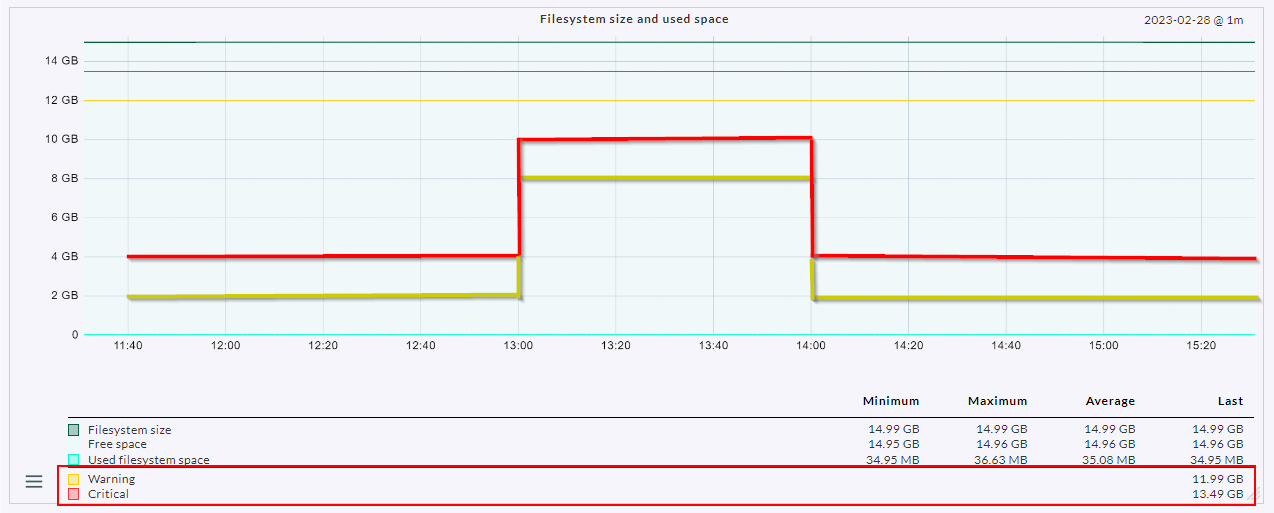
In the Checkmk GUI, only the current threshold value is displayed as a continuous line in the graphs. It is not visible when a threshold has changed and/or at what time which time-dependent threshold was active. Especially with time-dependent thresholds, this is very irritating for the customer. The graph might imply that the threshold has been exceeded, and the customer wonders why he did not receive an alert for this.
It would be very helpful if the threshold could also be saved in the RRDs and displayed accordingly in the graph. So you would always see at which time which threshold was valid. To address the concerns about the additional disk space usage, you could let the customer decide via option "add thresholds: yes" in the "Configuration of RRD..." rule if he wants to save and see the threshold history or not.