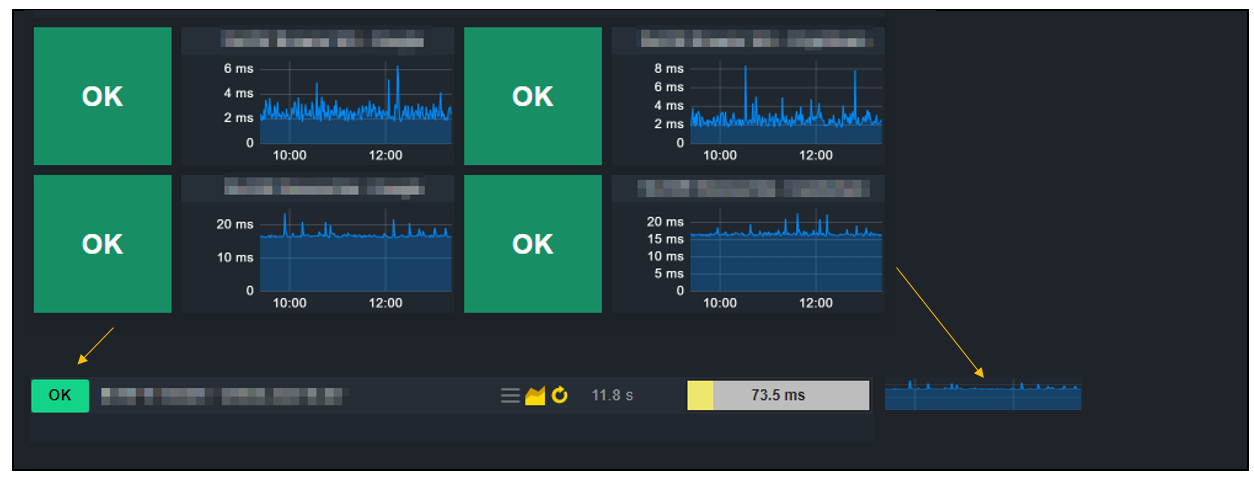
Dashboard Buttons, with link to other dashboards, and with status of the other dashboard.
We have a main dashboard, there should be a way to get from this main dashboard to another dashboard with a click of a button.
It would be cool if this button would show the status of the other dashboard, so if all checks on the board are green, the button on the main board is also green.
So something like "Service state" where you get OK/WARN/CRIT displayed.
In general, it would be great if you could make these "Service state Buttons" narrower, just like "Timeseries" elements would be better narrower. The "OK" button in a view is already a good size if you could make the graphs that small.
Comments: 1
-
29 Nov, '23
Daniel RoettgermannYes, very usefull. especially for any top-> bottom dashboards, but also views!
we also asked for it.
One example for views/dashboard:
Having a Dashboard with the main important overview points for your application hosts
Hostnames|CPU|Memory|Application load|application memory|number of criticals|number of wanirng
Now if I click on one host, I want to get to an application dashboard, which shows me more detail, ONLY for that host.
So, it needs to be possible
- to add a link to another view/dashboard on any column you add to your view
- make this dashboards/views even generic, so you dont need to create a dashboard for every host in your view
- adding the option for blank/customize(name) buttons with adding links behind it