Add graph display options to custom graphs
2
votes
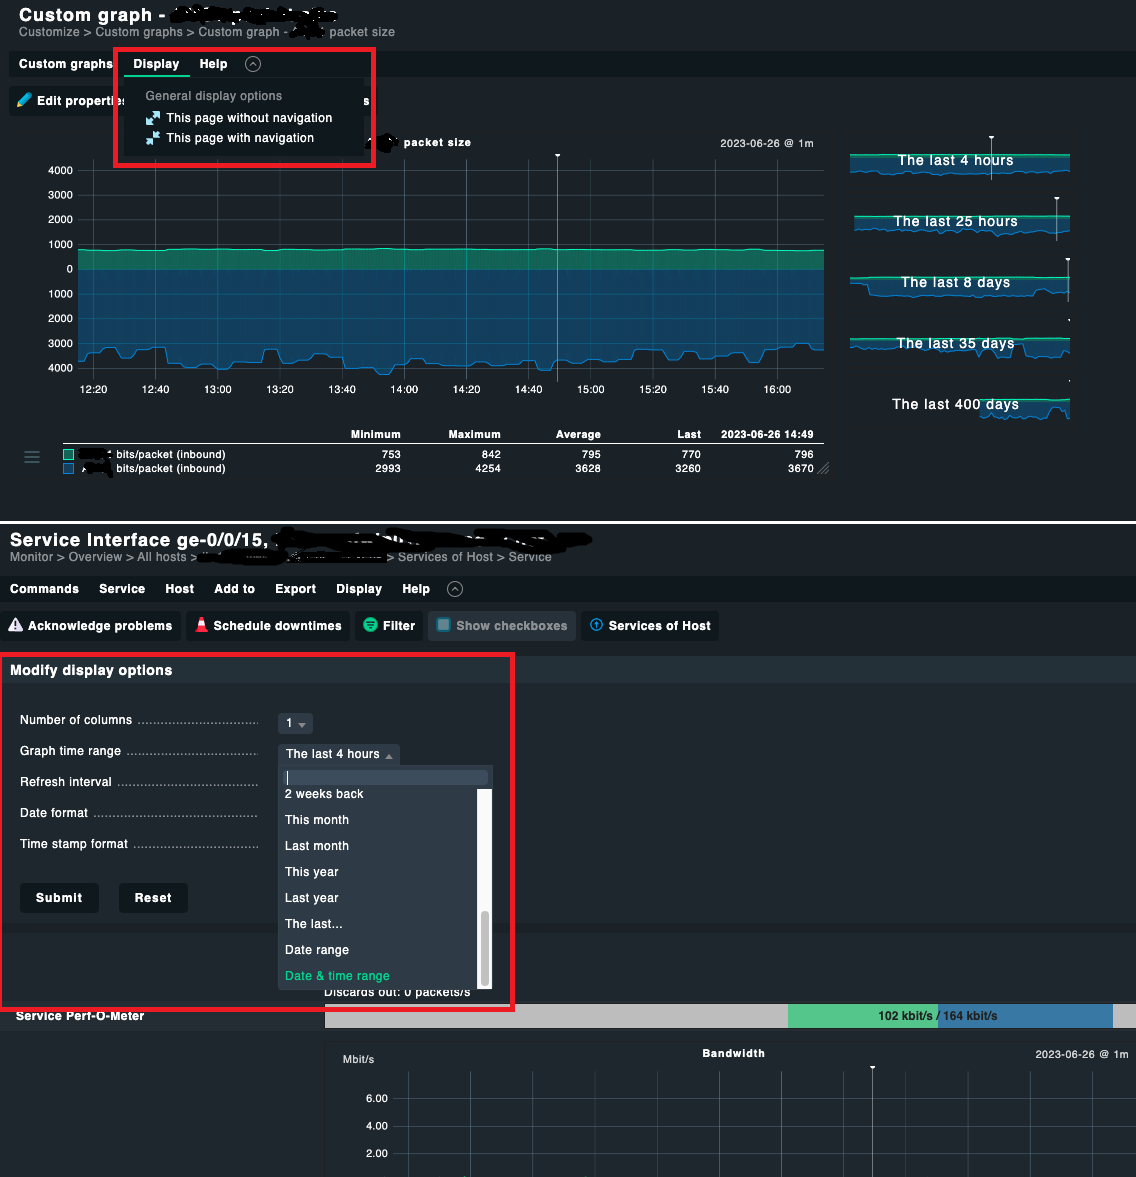
When you view a service that includes graphed data, you can specify an exact time/date range using:
Display > Modify Display Options > Select Date range or Date and Time range in “Graph Time Range”
But this option is not available when viewing a custom graph. It would be useful to have this available and it would make for a more consistent user experience.